

Image Details
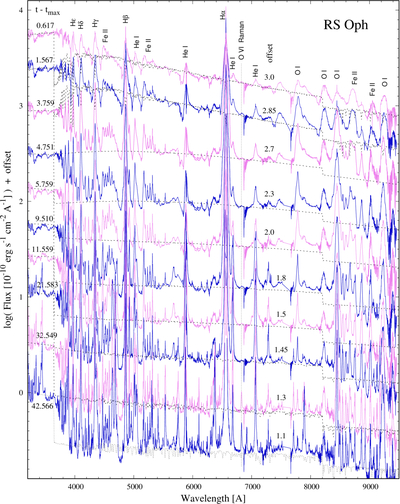
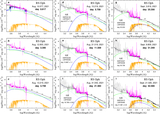
Caption: Figure 12.
The evolution of the RS Oph optical spectrum measured by the UVES spectrograph from day 0.617 to day 42.566. A strong nebular continuum is indicated by the Balmer jump in emission. It dominates the spectrum from day 3.7, when the overall continuum flattens (see also Figure 11). Dotted lines represent our SED models (Equation (1) or (2) for parameters in Table 3).
Other Images in This Article
Show More
Copyright and Terms & Conditions
© 2026. The Author(s). Published by the American Astronomical Society.

Copyright ©
2026 Astronomy Image Explorer. All Rights Reserved.
