

Image Details
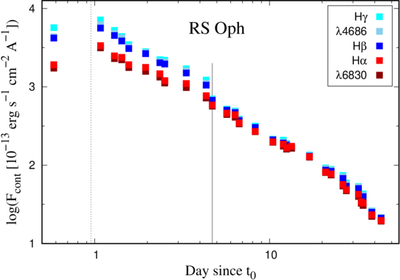
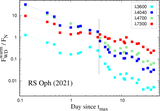
Caption: Figure 11.
Evolution of the continuum fluxes, Fcont., at/around selected emission lines (see keys) given by SED models. The vertical dotted line indicates the time of the optical maximum (see Table 2), and the gray line at day 4.7 denotes the time of spectrum flattening, when the continuum fluxes in the blue part (at Hγ and Hβ) became nearly equal to those in the red part (at Hα and λ6,830).
Other Images in This Article
Show More
Copyright and Terms & Conditions
© 2026. The Author(s). Published by the American Astronomical Society.

Copyright ©
2026 Astronomy Image Explorer. All Rights Reserved.
