

Image Details
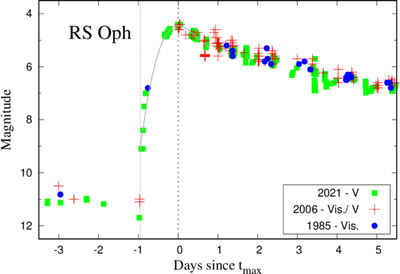
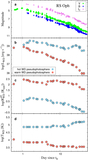
Caption: Figure 1.
Comparison of V and visual LCs of RS Oph around the maxima of its explosions in 2021, 2006, and 1985. The gray curve is a third-degree polynomial that fits the V magnitudes around the 2021 maximum. The vertical dotted and dashed lines indicate the time of the brightness onset and its maximum, respectively (Table 2, Section 3.1).
Other Images in This Article
Show More
Copyright and Terms & Conditions
© 2026. The Author(s). Published by the American Astronomical Society.

Copyright ©
2026 Astronomy Image Explorer. All Rights Reserved.
