

Image Details
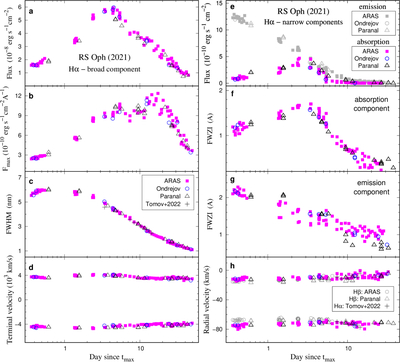
Caption: Figure 8.
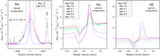
Evolution of the Hα line parameters. Left: the broad component is shown. The flux (panel (a)), its maximum height, ﹩{F}_{{\rm{\max }}}﹩, above the continuum (panel (b)), FWHM (panel (c)), and terminal velocities of the wings (panel (d)) are detailed. A description of these panels is in Section 3.5.1, and the data are given in Table 9. Right: the narrow components are shown. The fluxes (panel (e)), FWZI of the absorption (panel (f)) and emission (panel (g)) component, and their radial velocities (panel (h)) are depicted. Their description and interpretation can be found in Sections 3.5.2 and 4.5, respectively.
Other Images in This Article
Show More
Copyright and Terms & Conditions
© 2026. The Author(s). Published by the American Astronomical Society.

