

Image Details
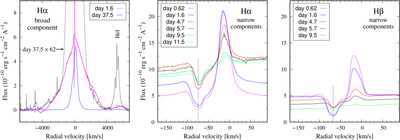
Caption: Figure 7.
Example of the evolution of the broad and narrow components of the hydrogen line profiles measured on UVES spectra. The left panel shows the Hα broad component measured on days 1.567 and 37.532. This comparison shows a significant narrowing of the line emission core (see Figure 8(c)), although the expansive, weak line wings remain present even in the later stage of nova evolution. The local continuum is subtracted (see Section 3.5.1). The right panels show the evolution of the narrow components in the Hα and Hβ profiles. Note that the transition from the emission to the absorption component is not smooth, so the resulting profile is not exactly of the P Cygni type. The vertical gray lines indicate the positions of the absorption component in the Hα and Hβ profiles, which differ by ∼7 km s−1 during the first days after ﹩{t}_{{\rm{\max }}}﹩ (see Figure 8(h) and Section 3.5.2).
Other Images in This Article
Show More
Copyright and Terms & Conditions
© 2026. The Author(s). Published by the American Astronomical Society.

