

Image Details
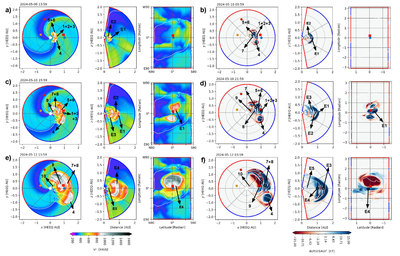
Caption: Figure 4.
EUHFORI12A simulation, vJmap (CME3 GCS), result of vr (a), (c), (e) and scaled Bclt, i.e., −Bz, (r/1 au)2 (b), (d), (f) in the equatorial, meridional, and transversal planes, corresponding to different phases of CME–CME interactions. The subplots correspond to the formation of (a), (b) E1 and E2; (c), (d) E3; (e), (f) E4 and E5. The blue, orange, and red dots on the equatorial plane denote Earth, Venus, and Mercury, respectively. The red square denotes the STEREO-A spacecraft. The animations vr and Bz for the whole period of this superstorm are provided online.
(An animation of this figure is available in the online article.)
(An animation of this figure is available.)
The video/animation of this figure is available in the online journal.
Other Images in This Article
Copyright and Terms & Conditions
© 2026. The Author(s). Published by the American Astronomical Society.

