

Image Details
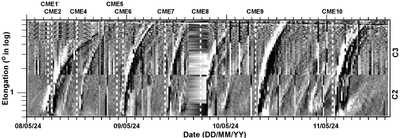
Caption: Figure 1.
SOHO time-elongation map (J-map) constructed from running-difference white-light observations of the LASCO C2 and C3 coronagraphs, showing the heliospheric propagation of 10 successive CMEs (CME1–CME10) during 2024 May 8–14. The plot shows the elongation angle (degrees) relative to the Sun–spacecraft line as a function of time. Each CME appears as a distinct bright, curved track whose slope corresponds to its apparent propagation speed and whose curvature reflects Thomson-scattering geometry and radial expansion.
Other Images in This Article
Copyright and Terms & Conditions
© 2026. The Author(s). Published by the American Astronomical Society.

Copyright ©
2026 Astronomy Image Explorer. All Rights Reserved.
