

Image Details
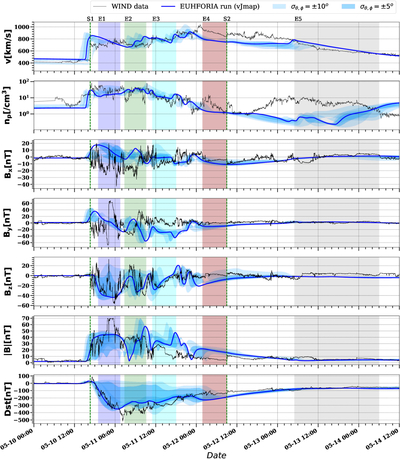
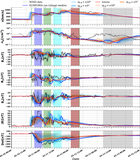
Caption: Figure 3.
EUHFORIA simulation of the CMEs 1–10 overplotted on the Wind measurements (black) corresponding to the “vJmap (CME3 GCS)” run. The dashed vertical green lines demarcate the observed shock signatures (S1, S2) and the shaded patches correspond to the observed intervals of the magnetic ejecta (E1, ..., E5) as characterized in Table 3. The shaded blue profile around the solid blue line shows the EUHFORIA predictions for virtual satellites located at 5° and 10° latitude–longitude shifts relative to Earth. The plot shows, from top to bottom, the speed v, the proton number density np, the magnetic field components Bx, By, Bz, the total magnetic field strength ∣B∣, the disturbance storm index Dst, and the plasma beta β.
Other Images in This Article
Copyright and Terms & Conditions
© 2026. The Author(s). Published by the American Astronomical Society.

