

Image Details
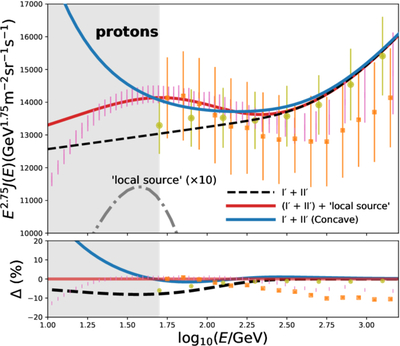
Caption: Figure 7.
Local CR proton spectrum multiplied by E2.75 in the energy range from 10 GeV to 1.5 TeV. Spectral measurements by AMS-02 (M. Aguilar et al. 2015), DAMPE (F. Alemanno et al. 2026), and CALET (O. Adriani et al. 2022) are shown. The figure illustrates two possible explanations for the mild concavity of the proton spectrum between 50 and 200 GeV, as discussed in the text. In scenario (a), a contribution from a hypothetical local source is added to the two-component CR model. The dotted–dashed gray curve shows the local-source contribution (multiplied by a factor of 10 for clarity), while the solid red curve shows the corresponding total spectrum. In scenario (b), the first CR component is assumed to possess an intrinsic concave shape, as expected in nonlinear DSA models. The dotted–dashed purple curve represents the resulting spectrum. The dashed black curve shows the prediction of the original two-component model without any additional low-energy modification. The gray shaded region below 50 GeV corresponds to the energy range strongly affected by solar modulation.
Other Images in This Article
Copyright and Terms & Conditions
© 2026. The Author(s). Published by the American Astronomical Society.

