

Image Details
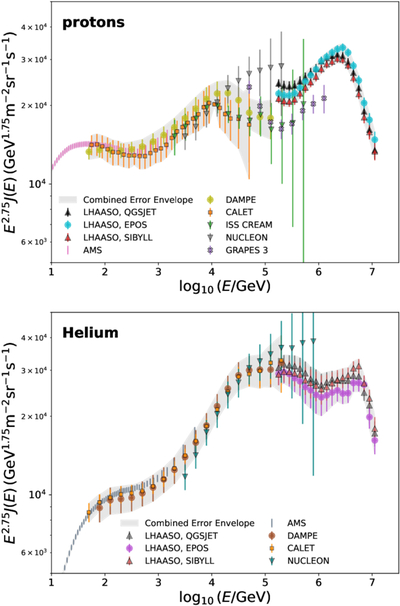
Caption: Figure 1.
CR proton (a) and helium (b) energy spectra, multiplied by E2.75, as a function of primary energy ﹩{\mathrm{log}}_{10}(E/{\rm{GeV}})﹩. (a) Proton measurements compiled from AMS (M. Aguilar et al. 2015), CALET (O. Adriani et al. 2022), DAMPE (F. Alemanno et al. 2026), ISS-CREAM (G. H. Choi et al. 2022), GRAPES-3 (F. Varsi et al. 2024), NUCLEON (N. Gorbunov et al. 2019), and LHAASO (Z. Cao et al. 2025c). (b) Helium measurements compiled from AMS (M. Aguilar et al. 2017), CALET (O. Adriani et al. 2023), DAMPE (F. Alemanno et al. 2026), NUCLEON (N. Gorbunov et al. 2019), and LHAASO (Z. Cao et al. 2026). For the LHAASO data in both panels, fluxes reconstructed using three high-energy hadronic interaction models (QGSJET-II-04, EPOS-LHC, and SIBYLL 2.3D) are shown separately. The shaded gray band represents a combined uncertainty envelope defined by the spread of the AMS-02, DAMPE, CALET, and LHAASO measurements. It illustrates the overall experimental dispersion rather than a formal statistical uncertainty.
Other Images in This Article
Copyright and Terms & Conditions
© 2026. The Author(s). Published by the American Astronomical Society.

