

Image Details
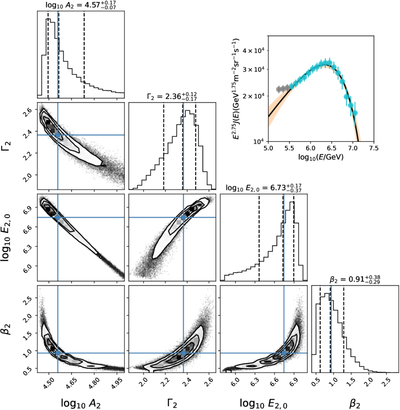
Caption: Figure 4.
Main panel: corner plot showing the posterior probability distributions for the model parameters for the second component. The sharpness parameter β2 is treated as a free index within the exponential cutoff to characterize the spectral curvature. Inset: the observed spectrum compared with the best-fit model (solid black line). The shaded orange region represents the 1σ (16th–84th percentile) uncertainty envelope derived from 200 Markov Chain Monte Carlo posterior samples, demonstrating the model’s consistency with the data.
Other Images in This Article
Copyright and Terms & Conditions
© 2026. The Author(s). Published by the American Astronomical Society.

Copyright ©
2026 Astronomy Image Explorer. All Rights Reserved.
