

Image Details
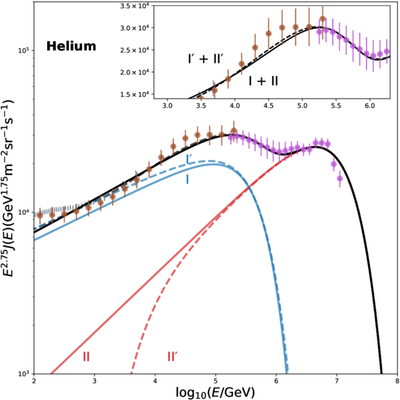
Caption: Figure 5.
CR helium spectrum multiplied by E2.75, with fit curves compared to measurements from AMS-02 (M. Aguilar et al. 2017), DAMPE (F. Alemanno et al. 2026), and LHAASO (Z. Cao et al. 2026). The blue and red curves represent the contributions of the first (I) and second (II) CR components, respectively. Two alternative assumptions for the extrapolation of the second component toward low energies are shown: (a) a pure power-law extrapolation (curves I and II) and (b) a scenario with low-energy hardening of the second component (curves ﹩{{\rm{I}}}^{{\prime} }﹩ and ﹩{{\rm{II}}}^{{\prime} }﹩), as discussed in the text. The solid and dashed black curves show the resulting total helium spectrum (I + II) for the (a) and (b) scenarios, respectively. The inset highlights the spectral structure in the multi-TeV energy range.
Other Images in This Article
Copyright and Terms & Conditions
© 2026. The Author(s). Published by the American Astronomical Society.

