

Image Details
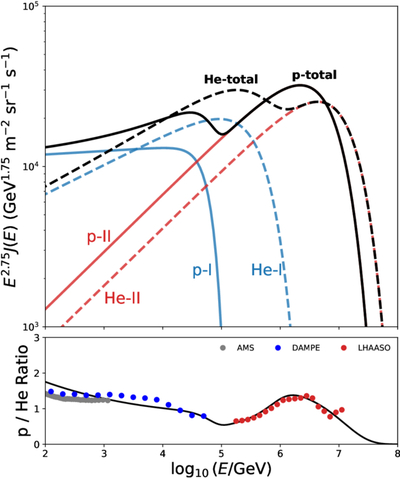
Caption: Figure 6.
Comparison of the two-component model for CR protons and helium. Top panel: energy spectra multiplied by E2.75 for protons (solid curves) and helium (dashed curves). For each species, the blue and red lines show the contributions of the first (I) and second (II) components, respectively. The black lines indicate the total modeled flux, with protons (solid line) and helium (dashed line). Bottom panel: the resulting proton-to-helium (p/He) flux ratio predicted by the model, compared with experimental measurements from the AMS, DAMPE, and LHAASO (Z. Cao et al. 2026).
Other Images in This Article
Copyright and Terms & Conditions
© 2026. The Author(s). Published by the American Astronomical Society.

Copyright ©
2026 Astronomy Image Explorer. All Rights Reserved.
