

Image Details
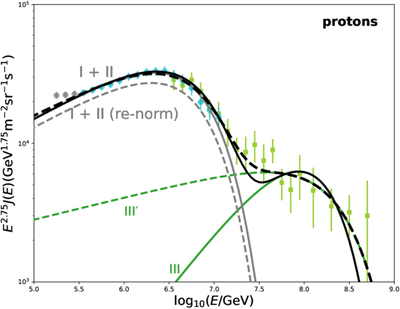
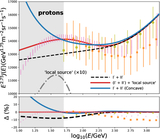
Caption: Figure 3.
CR proton spectrum multiplied by E2.75, with fit curves compared to the LHAASO (Z. Cao et al. 2025c) and IceTop (M. G. Aartsen et al. 2019) measurements. The gray and green curves show the contributions of the first and second (I + II) and third (III) proton components, respectively. The sum of the first, second, and third components is shown by the black curves. The solid curves correspond to the case when the flux of I + II is fixed and coincides with the flux in Figure 2 for the scenario (a). The dashed curves are obtained from the joint LHAASO and IceTop data fit. The corresponding best-fit parameters are listed in Table 2.
Other Images in This Article
Copyright and Terms & Conditions
© 2026. The Author(s). Published by the American Astronomical Society.

