

Image Details
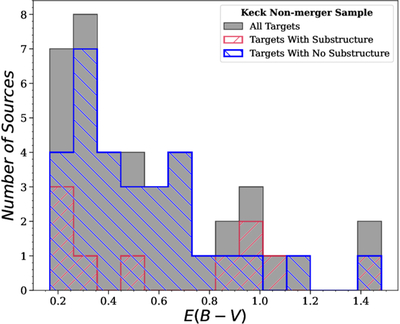
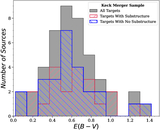
Caption: Figure 8.
Distribution of optical extinction, parameterized by the color excess E(B − V), for the Keck Nonmerger Comparison Sample. Extinction values are drawn from the MPA-JHU DR8 Catalog (G. Kauffmann et al. 2003a; J. Brinchmann et al. 2004; C. A. Tremonti et al. 2004). The gray histogram shows the full sample, while the blue hatched bins and crimson hatched bins indicate systems without and with detected NIR substructure in archival Keck AO imaging, respectively (see Section 4.1). This figure provides a direct comparison to the Primary Keck AO Merger Sample by characterizing the extinction properties of nonmergers with SDSS/WISE positional offsets. The implications for substructure detection and the role of astrometric offsets are discussed in Section 4.1.
Other Images in This Article
Show More
Copyright and Terms & Conditions
© 2026. The Author(s). Published by the American Astronomical Society.

