

Image Details
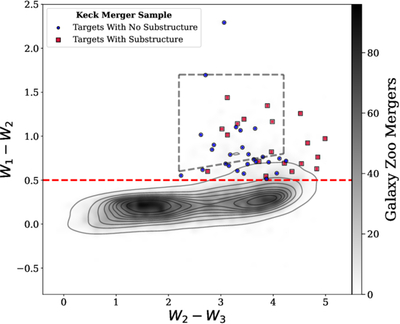
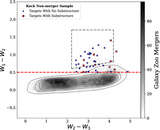
Caption: Figure 3.
WISE MIR color–color diagram (W1 − W2 versus W2 − W3) for the 46 targets in the Primary Keck AO Merger Sample, shown relative to the parent population of highly disturbed Galaxy Zoo mergers (fm > 0.4; shaded contours). The blue circles denote targets without detected NIR substructure, while the crimson squares indicate targets for which substructure is identified in Keck AO imaging (see Section 4.1). The red dotted horizontal line shows the MIR-color-selection criterion (W1 − W2 > 0.5) used to construct the sample, which preferentially selects systems likely to host accreting SMBHs (L. Blecha et al. 2018). The dashed gray box outlines the stringent MIR AGN selection wedge defined by T. H. Jarrett et al. (2011). This figure serves two purposes. First, it demonstrates that the SDSS/WISE offset-selected sample occupies a distinct region of MIR diagnostic space compared to the general merger population, consistent with the MIR AGN preselection criteria. Second, by identifying which targets contain resolved NIR substructure, this figure provides the MIR classification context needed to interpret the substructure detection rates presented in Section 4.1, enabling assessment of how substructure incidence depends on MIR AGN diagnostics. One target (J152659) is not included due to the absence of a reliable W3 measurement.
Other Images in This Article
Show More
Copyright and Terms & Conditions
© 2026. The Author(s). Published by the American Astronomical Society.

