

Image Details
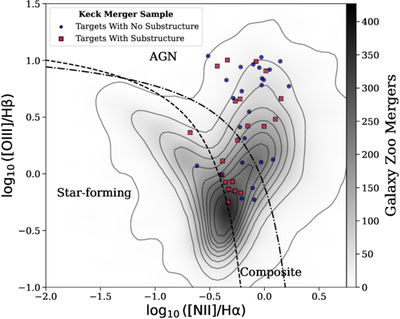
Caption: Figure 2.
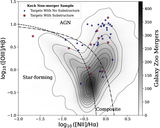
BPT diagram for the Primary Keck AO Merger Sample (46 systems with SDSS/WISE offsets <1﹩\mathop{.}\limits^{{\unicode{x02033}}}﹩5), shown relative to the general population of highly disturbed Galaxy Zoo mergers (fm > 0.4; shaded contours). Narrow emission-line ratios are drawn from the MPA-JHU DR8 catalog (G. Kauffmann et al. 2003a; J. Brinchmann et al. 2004; C. A. Tremonti et al. 2004). The crimson squares denote systems for which Keck AO imaging reveals previously unresolved NIR substructure, while the blue points indicate systems with no detected substructure. The empirical SF demarcation from G. Kauffmann et al. (2003b) (dashed line) and the theoretical maximum starburst boundary from L. J. Kewley et al. (2001) (dashed–dotted line) are shown for reference; galaxies between these curves are classified as composite systems. This figure demonstrates that the SDSS/WISE offset-selected sample is preferentially composed of AGN and composite classifications compared to the general merger population, as expected given the MIR AGN selection. The substructure classifications are shown here to provide diagnostic context for the sample and to illustrate where systems with and without detected substructure reside in optical emission-line parameter space. The definition of substructure and its relationship to the SDSS/WISE offsets are presented in Section 4.1. One target (J033037) is excluded due to insufficient SNR (<5) in the required emission lines.
Other Images in This Article
Show More
Copyright and Terms & Conditions
© 2026. The Author(s). Published by the American Astronomical Society.

