

Image Details
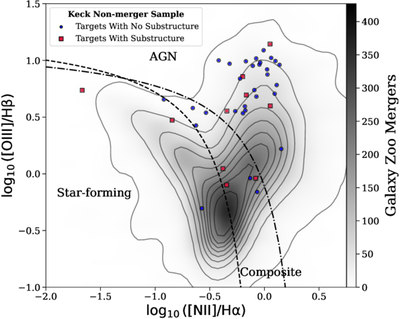
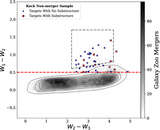
Caption: Figure 6.
BPT diagram for the Keck Nonmerger Comparison Sample (40 galaxies with SDSS/WISE offsets but no merger classification, fm < 0.4), shown relative to the general population of Galaxy Zoo mergers (fm > 0.4; shaded contours). The crimson squares denote systems for which Keck AO imaging reveals NIR substructure, while the blue points indicate systems with no detected substructure. The empirical SF demarcation from G. Kauffmann et al. (2003b) (dashed line) and the theoretical maximum starburst boundary from L. J. Kewley et al. (2001) (dashed–dotted line) are shown for reference. This figure demonstrates that the Keck Nonmerger Comparison Sample spans a similar range of optical spectroscopic classifications as the Primary Keck AO Merger Sample, allowing us to assess whether SDSS/WISE offsets alone, independent of merger status, are associated with unresolved NIR substructure.
Other Images in This Article
Show More
Copyright and Terms & Conditions
© 2026. The Author(s). Published by the American Astronomical Society.

