

Image Details
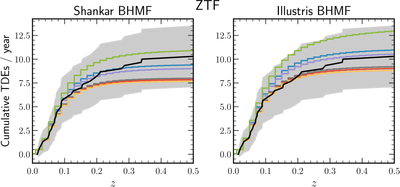
Caption: Figure 9.
Cumulative redshift distribution of TDEs observed by ZTF. The black line shows the observed TDEs from the ∼3 yr flux-limited ZTF sample in Y23, and the surrounding shaded region indicates the Poisson uncertainty. The filled curves show our modeled TDE rates, scaled using the ZTF loss factor. While the models differ slightly, all fall within the ZTF uncertainty region, rendering them indistinguishable.
Other Images in This Article
Copyright and Terms & Conditions
© 2026. The Author(s). Published by the American Astronomical Society.

Copyright ©
2026 Astronomy Image Explorer. All Rights Reserved.
