

Image Details
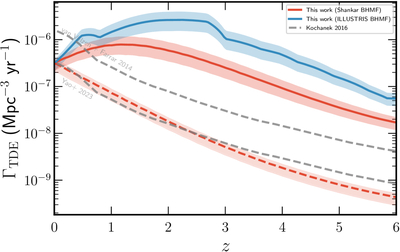
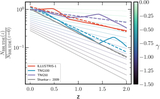
Caption: Figure 5.
Volumetric TDE rate as a function of redshift after applying all redshift-dependent rate modifications. The red line uses the F. Shankar et al. (2009) BHMF model, while the blue line uses the Illustris simulation. The shaded regions show the 1σ confidence intervals obtained from Monte Carlo sampling of all uncertain parameters. Previous calculations using the same F. Shankar et al. (2009) BHMF were presented in C. S. Kochanek (2016) and are plotted as the gray dashed line. Because those calculations were calibrated to an earlier TDE rate measurement from S. van Velzen & G. R. Farrar (2014), we recalibrate them to the Y23 local rate and compare them with our BHMF-only rate (the dashed red line).
Other Images in This Article
Copyright and Terms & Conditions
© 2026. The Author(s). Published by the American Astronomical Society.

