

Image Details
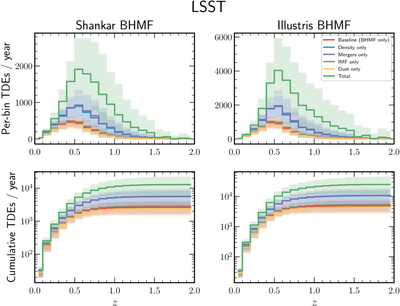
Caption: Figure 6.
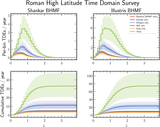
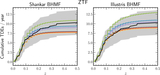
Predicted observed TDE rates in the Vera Rubin Observatory LSST. The left two panels assume the F. Shankar et al. (2009) BHMF, while the right two panels assume the Illustris simulation BHMF. The top two panels show the number of TDEs per redshift bin, and the bottom two show the total cumulative number of TDEs out to redshift z. Each line shows a different single redshift-dependent rate modification (including the BHMF), while the green line shows them all combined.
Other Images in This Article
Copyright and Terms & Conditions
© 2026. The Author(s). Published by the American Astronomical Society.

Copyright ©
2026 Astronomy Image Explorer. All Rights Reserved.
