

Image Details
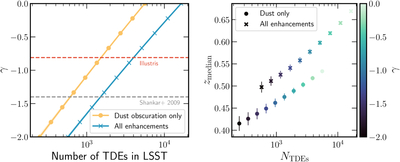
Caption: Figure 11.
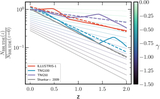
Left: number of TDEs detected in a flux-limited LSST survey vs. the exponent index of the evolution of the BHMF (Equation (23); see Figure 10). The lowest prediction corresponds to the dust-only calculation (yellow circles), while the highest corresponds to the total calculation (blue ×’s); all predicted TDE yields lie between these lines. The exponent indices fit to the F. Shankar et al. (2009) and the Illustris mass functions are indicated by horizontal dotted lines. Right: number of TDEs detected in a flux-limited LSST survey vs. the median redshift of each sample. The exponent index (y-axis of the left panel) is represented by the color scale. Uncertainties in the sample medians are calculated via bootstrap resampling.
Other Images in This Article
Copyright and Terms & Conditions
© 2026. The Author(s). Published by the American Astronomical Society.

