

Image Details
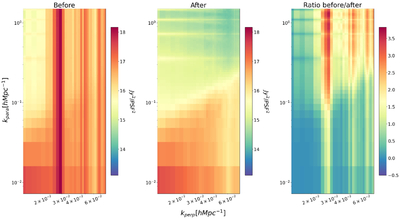
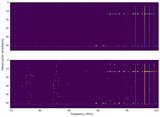
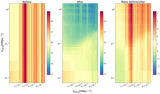
Caption: Figure 8.
This figure shows the 2D auto power spectra of the observation data before (left) and after (middle) applying GRANDWin, and the log-scaled ratio of before to after (right). The removed power is predominantly from higher-frequency regions, suggesting the presence of RFI that was mitigated by the winsorizing method on the gain-calibration solutions.
Other Images in This Article
Copyright and Terms & Conditions
© 2026. The Author(s). Published by the American Astronomical Society.

Copyright ©
2026 Astronomy Image Explorer. All Rights Reserved.
