

Image Details
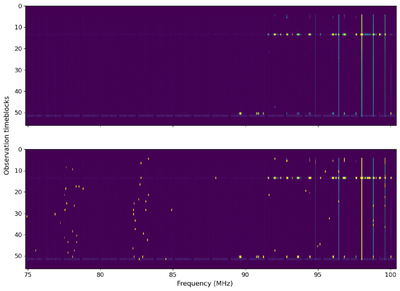
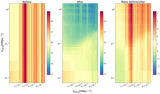
Caption: Figure 6.
Comparison of flagging occupancy between AOFlagger (top panel) and AOFlagger with GRANDWin (bottom panel). The x-axis represents frequency channels, and the y-axis corresponds to observation time blocks. Yellow marks indicate all baselines being flagged.
Other Images in This Article
Copyright and Terms & Conditions
© 2026. The Author(s). Published by the American Astronomical Society.

Copyright ©
2026 Astronomy Image Explorer. All Rights Reserved.
