

Image Details
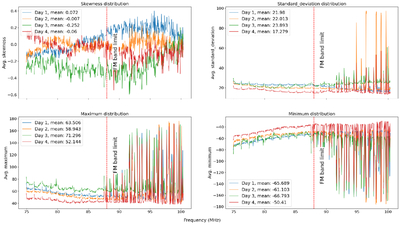
Caption: Figure 4.
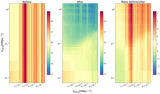
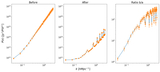
The time-series phase part of the gain-calibration solutions skewness (top left), standard deviation (top right), maximum (bottom left), and minimum (bottom right) for the diagonal elements of the Jones calibration solutions before applying GRANDWin across 4 observation days. Vertical dashed lines mark the FM band limits. Outliers strongly affect these metrics across frequency. After applying GRANDWin, their values are reduced, indicating improved robustness.
Other Images in This Article
Copyright and Terms & Conditions
© 2026. The Author(s). Published by the American Astronomical Society.

Copyright ©
2026 Astronomy Image Explorer. All Rights Reserved.
