

Image Details
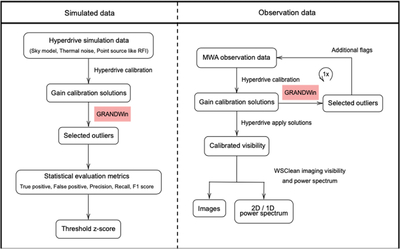
Caption: Figure 1.
Processing pipelines for simulated data (left) and observation data (right). The simulated data pipeline simulates visibilities, adds system temperature and RFI of varying intensities, and detects outliers from gain-calibration solutions using winsorizing, which is evaluated using FP, TP, and F1 scores. The observation pipeline performs calibration, outlier detection using the gain-calibration solutions, additional flagging, and recalibration. Then it images the data with WSClean to construct power spectra for evaluation.
Other Images in This Article
Copyright and Terms & Conditions
© 2026. The Author(s). Published by the American Astronomical Society.

Copyright ©
2026 Astronomy Image Explorer. All Rights Reserved.
