

Image Details
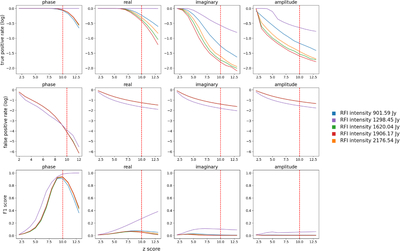
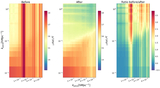
Caption: Figure 3.
Performance example of GRANDWin on simulated data with five RFI intensity levels, using 2 s solution intervals and a negative z-score threshold in logarithmic scale for TP and FP rate. The bottom row shows the F1 score, which quantifies overall detection effectiveness. The vertical red dashed line marks the selected threshold at ∣z∣ < 10. This evaluation highlights the trade-off between sensitivity and FP across different RFI intensities.
Other Images in This Article
Copyright and Terms & Conditions
© 2026. The Author(s). Published by the American Astronomical Society.

Copyright ©
2026 Astronomy Image Explorer. All Rights Reserved.
