Image Details
Caption: Figure 5.
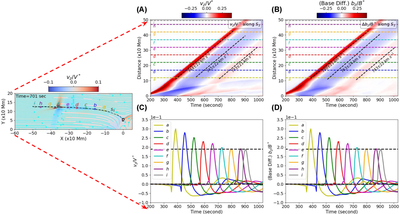
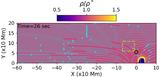
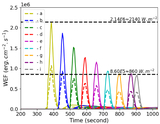
The left panel shows the vz map at t = 701 s with a curved slit S3, starting from right to left along the path of the propagating Alfvén wave packet. The independent points a (yellow), b (blue), c (green), d (red), e (magenta), f (cyan), g (orange), h (purple), and i (gray) have been taken on the S3 to understand the properties of vz at different locations. Panels (a) and (b) are time–distance profiles of vz and Δbz = (Bz − 0.5)B* along S3. All the horizontal dotted lines on the time-distance profiles of vz and Δbz represent independent positions on S3 as depicted in the left panel (the line colors kept the same as the colors of chosen points). Panels (c) and (d) represent the temporal profile of vz and Δbz at those points, and both vz and Δbz are in the same phase and in agreement with the properties of the Alfvén waves.
Other Images in This Article
Copyright and Terms & Conditions
© 2026. The Author(s). Published by the American Astronomical Society.