Image Details
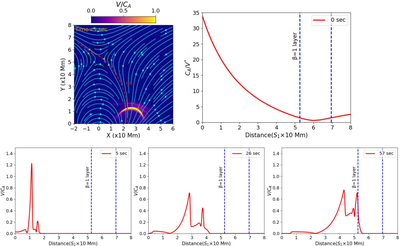
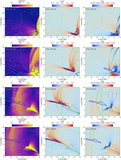
Caption: Figure 8.
Top left panel: v/cA map of the fast magnetoacoustic perturbation at t = 5 s; the dotted red line represents a curved slit chosen from bottom to top through the null region. The FOV of the zoomed-in region of the numerical domain is x = [−20 Mm, 60 Mm], y = [0 Mm, 80 Mm], and the black circular contour represents the β = 1 layer. Top right panel: the spatial variation of the normalized Alfvén speed (cA/V*) along S1 at t = 0 s; the vertical blue dotted line represents the β = 1 layer on the path of S1. Bottom panels: the spatial characteristics of the ratio of magnetoacoustic perturbation amplitude and local Alfvén speed (v/cA) on the slit S1 at t = 5 s, t = 26 s, and t = 57 s (left to right).
Other Images in This Article
Copyright and Terms & Conditions
© 2026. The Author(s). Published by the American Astronomical Society.