Image Details
Caption: Figure 1.
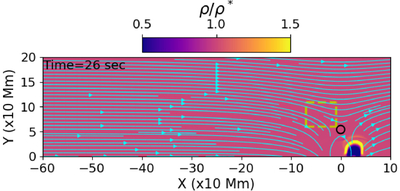
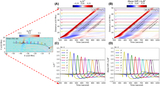
The density map at t = 26 s is shown with bipolar magnetic field topology overplotted as cyan streamlines. The yellow dashed box is the region of interest for our further analysis, and the black contour is a β = 1 region. The fast magnetoacoustic wavelike perturbations are evident in the lower right part moving toward the null region. An animation of real-time duration 10 s showing the entire dynamics in density from 0 to 1025 s is available in the online version.
(An animation of this figure is available in the online article.)
(An animation of this figure is available.)
The video/animation of this figure is available in the online journal.
Other Images in This Article
Copyright and Terms & Conditions
© 2026. The Author(s). Published by the American Astronomical Society.