Image Details
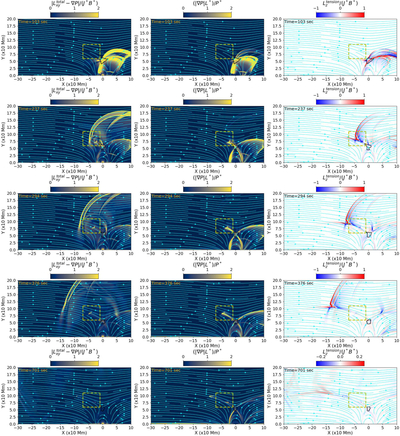
Caption: Figure 3.
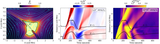
The first column is the map of total planar Lorentz force (﹩{L}_{xy}^{\mathrm{total}}﹩) plus the plasma pressure gradient force (−∇ P) at t = 103, 237, 294, 376, and 701 s (top to bottom). The signal in the planar Lorentz force has been observed for the fast wave front propagation, but no detectable signal is present in conjunction with the generation of vz fluctuations. In addition, the magnitude of plasma pressure gradient force maps in the middle column shows the effect very near to the null point for the generation of plasma flow just behind the Alfvénic fluctuations. The remaining columns represent the evolution of the magnetic tension (﹩{L}_{z}^{\mathrm{tension}}﹩) part associated with the Alfvén wave packet. The evolution of all the force components from 0 to 1025 s is available online as an animation with a real-time duration of 10 s.
(An animation of this figure is available in the online article.)
(An animation of this figure is available.)
The video/animation of this figure is available in the online journal.
Other Images in This Article
Copyright and Terms & Conditions
© 2026. The Author(s). Published by the American Astronomical Society.