Image Details
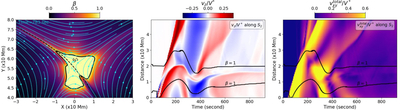
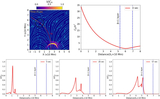
Caption: Figure 6.
Left panel: zoomed-in region of the plasma beta map with range 0–1 at t = 283 s. The black solid contour is the β = 1 layer, whereas the black dotted curved slit (S2) is taken from bottom right to top left through the null region. Middle panel: time–distance profile with embedded β = 1 layer of vz along S2. Through the equipartition layer the periodic fluctuations are seen to generate and propagate along the separatrix. Right panel: time–distance profile of the planar velocity (﹩{v}_{xy}^{\mathrm{total}}﹩) along S2. No periodic fluctuations are observed in ﹩{v}_{xy}^{\mathrm{total}}﹩, but a flow of plasma is seen surging just behind the vz signal.
Other Images in This Article
Copyright and Terms & Conditions
© 2026. The Author(s). Published by the American Astronomical Society.