Image Details
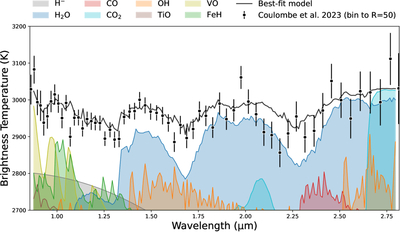
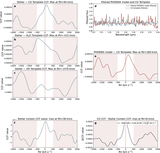
Caption: Figure 10.
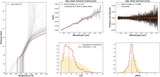
Contribution of atmospheric species to the brightness temperature spectrum of WASP-18 b, as derived from our free-chemistry retrieval. The solid black line represents the best-fit model. The shaded colored regions indicate the individual contributions of different chemical species to the total opacity. The black points with error bars are the brightness temperature spectrum from L.-P. Coulombe et al. (2023).
Other Images in This Article
Show More
Copyright and Terms & Conditions
© 2026. The Author(s). Published by the American Astronomical Society.
Copyright ©
2026 Astronomy Image Explorer. All Rights Reserved.