Image Details
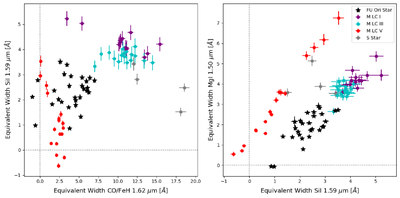
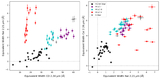
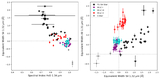
Caption: Figure 8.
FUOr diagnostics in the H band. On the left, a plot of FeH 1.62 μm vs. Si I 1.59 μm EWs compares a strong molecule with an atomic feature. The FeH 1.62 μm strength has a weak temperature dependence, and the gap between giants and dwarfs is due to the feature strength decreasing with increasing surface gravity. FUOrs have intermediate FeH 1.62 μm and also Si I 1.59 μm, which is on average stronger than dwarfs and weaker than giants. On the right, a plot of Si I 1.59 μm vs. Mg I 1.50 μm EWs compares two atomic features. For the M dwarfs, this parameter space shows a linear sequence with the feature strengths peaking at late K/early M spectral types and decreasing toward cooler M types; the S-type sources also reside along this sequence. The FUOrs have Mg I 1.50 μm line strengths similar to those of the M dwarfs, but as noted above, stronger Si I 1.59 μm compared to that of the dwarfs, residing closer to but weaker than in the giants.
Other Images in This Article
Show More
Copyright and Terms & Conditions
© 2026. The Author(s). Published by the American Astronomical Society.