Image Details
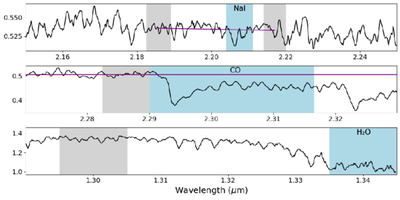
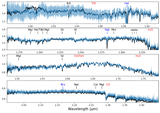
Caption: Figure 6.
Illustration of each of our three spectral feature measurement techniques conducted on the median FUOr spectrum from Figure 5. Blue shaded regions encompass the targeted feature, while gray shaded regions show the continuum region(s). The purple line represents the fitted continuum as described in Section 4.4. The top panel shows the Na I 2.21 μm doublet as an example of a standard two-sided EW technique. The middle panel shows CO 2.30 μm, a one-sided EW technique. The bottom panel shows H2O 1.34 μm as an example of a spectral index. A full catalog showing the measurement ranges of each feature can be found in Appendix C.
Other Images in This Article
Show More
Copyright and Terms & Conditions
© 2026. The Author(s). Published by the American Astronomical Society.