Image Details
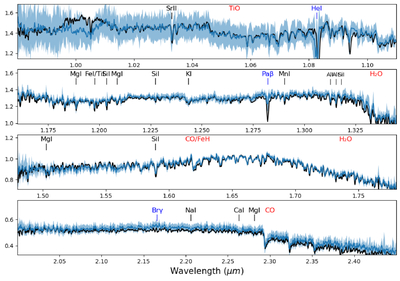
Caption: Figure 5.
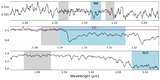
The sigma-clipped median flux (blue line) and median absolute deviation (blue shaded region) constructed after applying our dereddening procedure to all observed FUOrs in our sample. This is compared to the spectrum of the prototype FU Ori itself (black). Spectral features that we measure are labeled, with atomic lines in black, molecules in red, and wind-sensitive lines in blue. The excellent match of the black and blue lines shows that FU Ori itself accurately represents the class. The low dispersion also shows that most of the spectral features are shared by all FUOrs. Increased scatter toward the Y band is largely due to decreasing signal-to-noise at the blue end of our spectral coverage and is considered insignificant. Increased scatter toward the K band is likely real and due to differing contributions among the sources from the passive (dust) disk. Scatter can also increase away from the wavelength of normalization (1.67 μm) due to errors in the AV correction.
(The data used to create this figure are available in the online article.)
(The data used to create this figure are available.)
Other Images in This Article
Show More
Copyright and Terms & Conditions
© 2026. The Author(s). Published by the American Astronomical Society.