Image Details
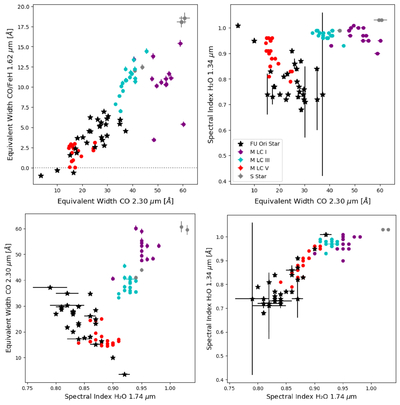
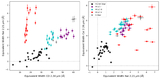
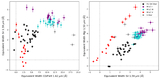
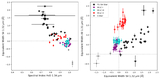
Caption: Figure 10.
Comparison of FUOr molecular diagnostics. In the top panels, the CO 2.30 μm EW in the K band is plotted vs. FeH 1.62 μm EW in the H band (left) and vs. the H2O 1.34 μm spectral index in the J band (right). Both plots show some overlap between FUOrs and M dwarfs, with the FUOrs tending to be slightly stronger than dwarfs and significantly weaker than giants in their molecular absorption. In the bottom panels, the H2O 1.74 μm spectral index in the H band is plotted vs. the CO 2.30 μm EW in the K band (left) and the H2O 1.34 μm spectral index in the J band (right).
Other Images in This Article
Show More
Copyright and Terms & Conditions
© 2026. The Author(s). Published by the American Astronomical Society.
Copyright ©
2026 Astronomy Image Explorer. All Rights Reserved.