Image Details
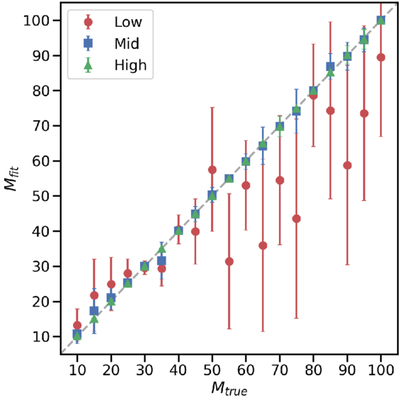
Caption: Figure 2.
Recovery of Pop III star mass from mock observations under three baseline element sets: low coverage (C, Mg, Ca, and Fe), mid coverage (C, Na, Mg, Al, Si, Ca, Ti, Fe, and Ni), and high coverage (C, N, O, Na, Mg, Al, Si, K, Ca, Ti, V, Mn, Fe, Co, and Ni). Each point shows the mean and standard deviation of the 100 recovered masses Mfit obtained from independent mock observations of a single HW10 model with the corresponding Mtrue, Etrue = 0.3, and Xtrue = 0, and noise level σ = 0.2; the gray dashed line denotes the one-to-one relation. The high coverage baseline places nearly all points on the dashed line, indicating near-perfect mass recovery in this process, whereas the low coverage baseline shows substantially larger scatter.
Other Images in This Article
Copyright and Terms & Conditions
© 2026. The Author(s). Published by the American Astronomical Society.