Image Details
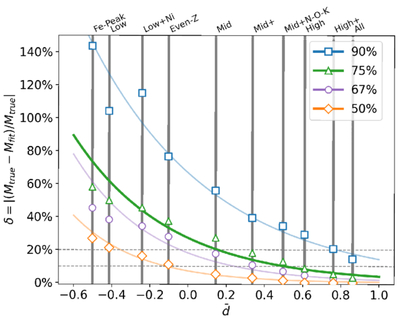
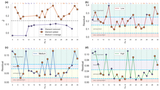
Caption: Figure 5.
Mapping between the fit quality metric ﹩\bar{d}﹩ and the fractional mass error δ = ∣(Mtrue − Mfit)/Mtrue∣. At the ﹩\bar{d}﹩ attained by 10 representative element sets (Fe-Peak, Low, Low+Ni, Even-Z, Mid, Mid+, Mid+N−O−K, High, High+, and All), scatter points show all δ values across the HW10 grid (16,800 models × 100 mocks =1.68 × 10⁶ points per set). Symbols mark the 50th, 68th, 75th, and 90th percentile thresholds at each ﹩\bar{d}﹩, and the smooth curves are exponential fits to these thresholds. The 75th percentile curve is highlighted (thicker line) since it is used to compute δ75 in Figure 6.
Other Images in This Article
Copyright and Terms & Conditions
© 2026. The Author(s). Published by the American Astronomical Society.
Copyright ©
2026 Astronomy Image Explorer. All Rights Reserved.