Image Details
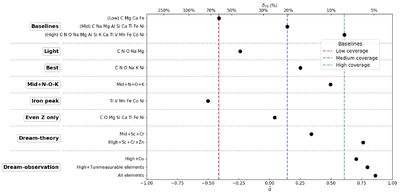
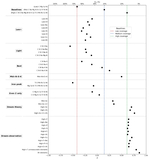
Caption: Figure 6.
Summary of mass recovery performance across different element sets. Each point corresponds to a tested element combination grouped by the category labels listed on the left. For each element set, we report its ﹩\bar{d}﹩ value together with the corresponding δ75 value, where δ75 denotes the 75th-percentile fractional mass error. The dashed reference lines indicate the low (red), medium (blue), and high (green) coverage baselines. In this framework, element sets lying to the right of the medium coverage baseline are considered as good mass recovery performance.
Other Images in This Article
Copyright and Terms & Conditions
© 2026. The Author(s). Published by the American Astronomical Society.
Copyright ©
2026 Astronomy Image Explorer. All Rights Reserved.