Image Details
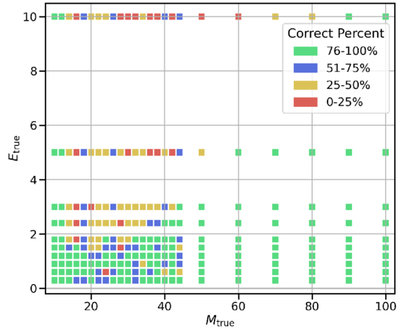
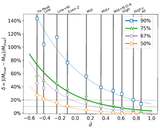
Caption: Figure 3.
Demonstration of the metric calculation on the Mtrue–Etrue grid at a fixed mixing X. For each HW10 model (Mtrue, Etrue), 100 mock observations are generated and fit to recover 100 Mfit. Points are colored by the fraction of correct recoveries, where a recovery is correct if ﹩\delta =\left|({M}_{\mathrm{true}}-{M}_{\mathrm{fit}})/{M}_{\mathrm{true}}\right|\lt 0.1﹩: green (76%−100%), blue (51%−75%), yellow (26%−50%), and red (0%−25%). The frame-level metric is d = (g + 0.5b − 0.5y − r)/N, where g, b, y, and r are counts of points in each color and N is the number of points; d ranges from −1 to 1, with higher values indicating better recovery. Example shown: Xtrue = 0 and the medium coverage baseline element set. Only part of the grid is displayed for clarity.
Other Images in This Article
Copyright and Terms & Conditions
© 2026. The Author(s). Published by the American Astronomical Society.