Image Details
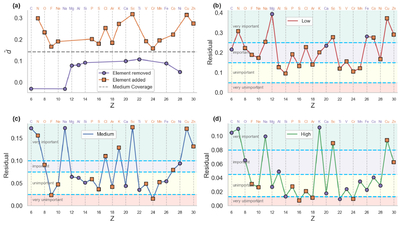
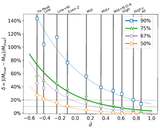
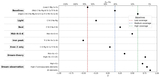
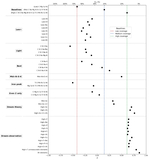
Caption: Figure 4.
Element-by-element perturbations of the baselines. (a) Medium baseline: ﹩\bar{d}﹩ versus atomic number Z when a single element is modified. The dashed line is the unmodified medium-baseline ﹩\bar{d}﹩. Purple circle markers indicate the element is removed from the baseline; orange square markers indicate an element is added to the baseline. Greater differences from the dashed line imply a larger effect on the metric. (b)–(d) Low (red), medium (blue), and high (green) coverage baselines: ﹩{\rm{\Delta }}\bar{d}=| {\bar{d}}_{\mathrm{modified}}-{\bar{d}}_{\mathrm{baseline}}| ﹩ versus Z. Horizontal dashed lines show the thresholds used to group elements into importance tiers. All results use 100 mocks per model and noise level σ = 0.2; ﹩\bar{d}﹩ is averaged over the 14 mixing values.
Other Images in This Article
Copyright and Terms & Conditions
© 2026. The Author(s). Published by the American Astronomical Society.