Image Details
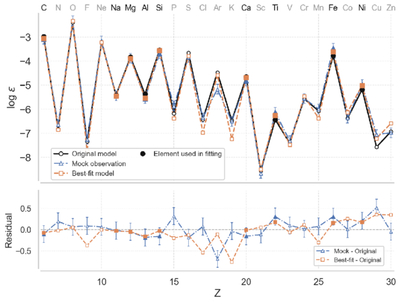
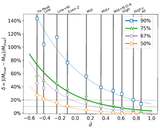
Caption: Figure 1.
Example of mock observation generation and mass recovery for an HW10 model. Top panel: black circles show the original model abundances in ﹩\mathrm{log}\varepsilon ﹩ with Mtrue = 17.4M⊙, Etrue = 2.4B, and Xtrue = 0.0; blue triangles show one mock observation generated by adding independent Gaussian noise with σ = 0.2 dex to each element (error bars indicate 1σ); orange squares show the best-fit HW10 model returned by a full-grid χ2 search with Mfit = 18.2M⊙, Efit = 2.4B, and Xfit = 0.251. In this example, the fit uses the medium coverage baseline defined in Section 2.2. Elements included in the fit are indicated by black element labels and filled markers, while excluded elements are shown with gray labels and open markers. Bottom panel: residuals relative to the original model, shown for the mock observation (blue; Mock−Original) and the best-fit model (orange; Best-fit−Original). Repeating this procedure over 100 independent noise realizations per model yields the distributions of recovered parameters used in the metric analysis in Section 2.3.
Other Images in This Article
Copyright and Terms & Conditions
© 2026. The Author(s). Published by the American Astronomical Society.