Image Details
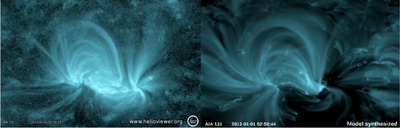
Caption: Figure 20.
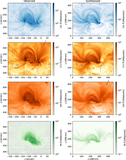
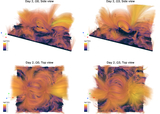
A snapshot of an animation that compares the observed and model-synthesized AIA 131 Å images. The animation, which runs for 17 s, covers the 2.5 hr time period on 2013 January 1 from 00:30:00 UT to 03:00:00 UT. The left half presents an animation of the observed AIA 131 Å images. The model-synthesized animation (D2_Ω3 model) is displayed on the right half. The observation animation is generated via www.helioviewer.org. The model-synthesized images are calculated through a line of sight 30∘ away from the vertical direction and parallel to the y–z plane, which is consistent with the latitude of the real active region. The synthesized animation is scaled logarithmically between 1 and 400 DN pixel−1 s−1, which is chosen to achieve the best visual comparison. The animation of this figure is available.
(An animation of this figure is available in the online article.)
(An animation of this figure is available.)
The video/animation of this figure is available in the online journal.
Other Images in This Article
Show More
Copyright and Terms & Conditions
© 2026. The Author(s). Published by the American Astronomical Society.