Image Details
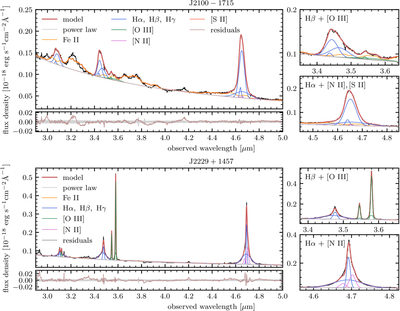
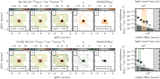
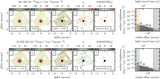
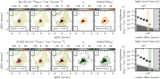
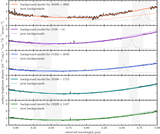
Caption: Figure 1.
Rest-optical spectra of quasars in our sample extracted over a 0﹩\mathop{.}\limits^{\unicode{x02033}}﹩2 (radius) aperture from the NIRSpec IFU observations presented here. For each quasar, we display the full spectrum (top left), the fit residuals (bottom left, pink), as well as a zoom-in on the Hβ and Hα emission line regions (top and bottom right, respectively). The various colored lines represent the median of the MCMC posterior distribution for the different spectral components, with the composite model shown in red. Note that the ±1σ measurement uncertainties on the extracted spectra are shown as gray shaded regions in the residual panel.
Other Images in This Article
Copyright and Terms & Conditions
© 2026. The Author(s). Published by the American Astronomical Society.