Image Details
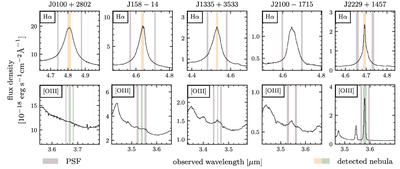
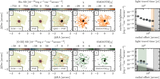
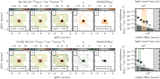
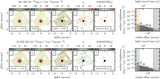
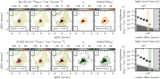
Caption: Figure 10.
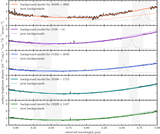
A summary of spectral regions used to construct the PSF (in purple) for each quasar and for both the Hα (top row, orange) and [O III] (bottom row, green) extended emission search. The spectral ranges of the median nebulae identified and shown in Figures 2, 3, 4, 5, and 6 are shown as orange/green shaded regions.
Other Images in This Article
Copyright and Terms & Conditions
© 2026. The Author(s). Published by the American Astronomical Society.
Copyright ©
2026 Astronomy Image Explorer. All Rights Reserved.