Image Details
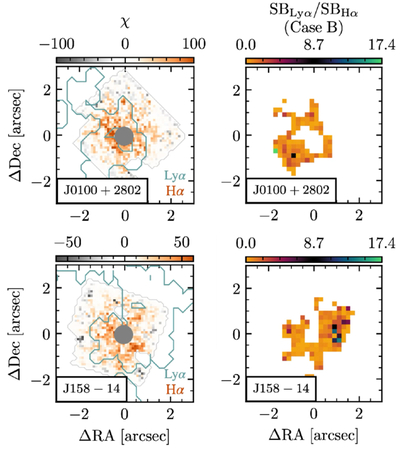
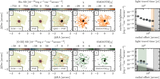
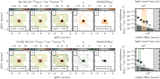
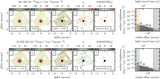
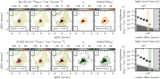
Caption: Figure 7.
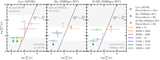
In the left column, we show the χ maps of the two quasars in our sample that have nebular detections in both Hα (this work, orange) and Lyα (blue contour D. Ďurovčíková et al. 2025a). To determine the mechanism behind the Lyα emission, we calculate Lyα-to-Hα surface brightness ratios using the region enclosed by the Lyα contour within the field of view of the NIRSpec IFU (right column). The gray circle with a radius of 0﹩\mathop{.}\limits^{\unicode{x02033}}﹩4 centered on the quasar marks the region that is dominated by PSF residuals in the MUSE data (Lyα) and so is excluded from the calculation.
Other Images in This Article
Copyright and Terms & Conditions
© 2026. The Author(s). Published by the American Astronomical Society.
Copyright ©
2026 Astronomy Image Explorer. All Rights Reserved.