Image Details
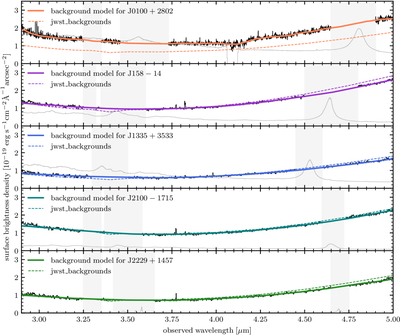
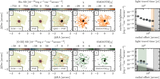
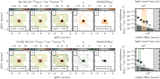
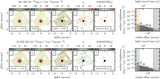
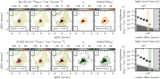
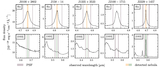
Caption: Figure 9.
For each quasar, we show the extracted model for the NIRSpec IFU background. In the background of each panel, we display the mean background spectrum extracted from the data cubes as described in Section 2.3 in black, the masked emission line wavelengths as gray shaded regions, and the quasar spectrum in gray for comparison. For comparison, we also show the predicted backgrounds from the jwst_backgrounds tool (dashed lines), which match very well for the medium-resolution observations (bottom four panels), but deviate from the empirical background of the high-resolution grating target (J0100+2802).
Other Images in This Article
Copyright and Terms & Conditions
© 2026. The Author(s). Published by the American Astronomical Society.
Copyright ©
2026 Astronomy Image Explorer. All Rights Reserved.