Image Details
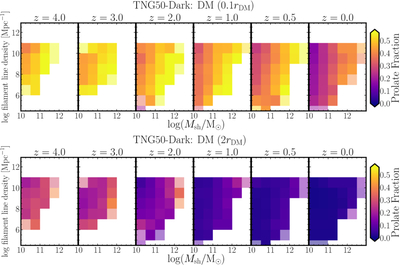
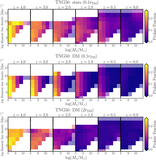
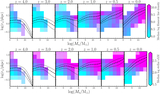
Caption: Figure 5.
Fraction of prolate subhalos (color bar) as a function of filament line density (y-axis) and subhalo DM mass (x-axis) at different redshifts in TNG50-Dark. The top and bottom rows represent the shape measured within 0.1rDM (inner halo) and 2rDM (outer halo), respectively. In this DM-only simulation, higher-mass halos (especially inner halos) are more prolate.
Other Images in This Article
Show More
Copyright and Terms & Conditions
© 2026. The Author(s). Published by the American Astronomical Society.
Copyright ©
2026 Astronomy Image Explorer. All Rights Reserved.