Image Details
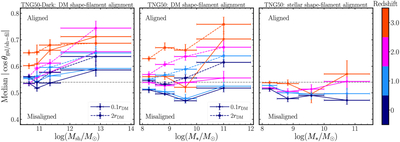
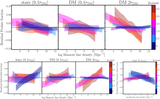
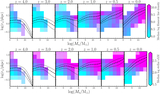
Caption: Figure 3.
Average shape–filament alignment as a function of mass, at a few different redshifts (indicated by the color bar on the right). The left panel shows the alignment between DM subhalo shape and the nearest filament at inner (solid) and outer (dashed) halo scales as a function of DM subhalo mass in TNG50-Dark. The middle and right panels present the DM shape–filament alignment and stellar shape–filament alignment, respectively, as functions of stellar mass in TNG50. DM halo shapes are generally more aligned with nearby filaments with increasing mass, while stars show almost no alignment with rising mass.
Other Images in This Article
Show More
Copyright and Terms & Conditions
© 2026. The Author(s). Published by the American Astronomical Society.